 Skip to content



If you are watching mortgage rates hoping for a big drop before you buy, I need to tell you something now instead of later.
You may be waiting a while.
That is not the bad news it sounds like. There is a number working underneath the headlines right now that actually works in your favor. Once you understand it, today’s rate looks different.
If you have been asking whether you should buy now or wait for lower mortgage rates, this is the market mechanic you need to understand before making that decision.
The mortgage rate in the headline is not one independent number. It reflects the 10-year Treasury yield plus the mortgage spread—and the rate you personally receive is then shaped by your own credit, debt-to-income ratio, down payment, loan structure, and property profile.
First, the pattern behind your rate.
Mortgage rates do not move on their own.
They tend to follow the 10-year Treasury yield, a number that reflects how investors are pricing economic growth, inflation, risk, and future interest-rate expectations. When the outlook looks strong, that yield often climbs. When the outlook gets shakier, it can ease.
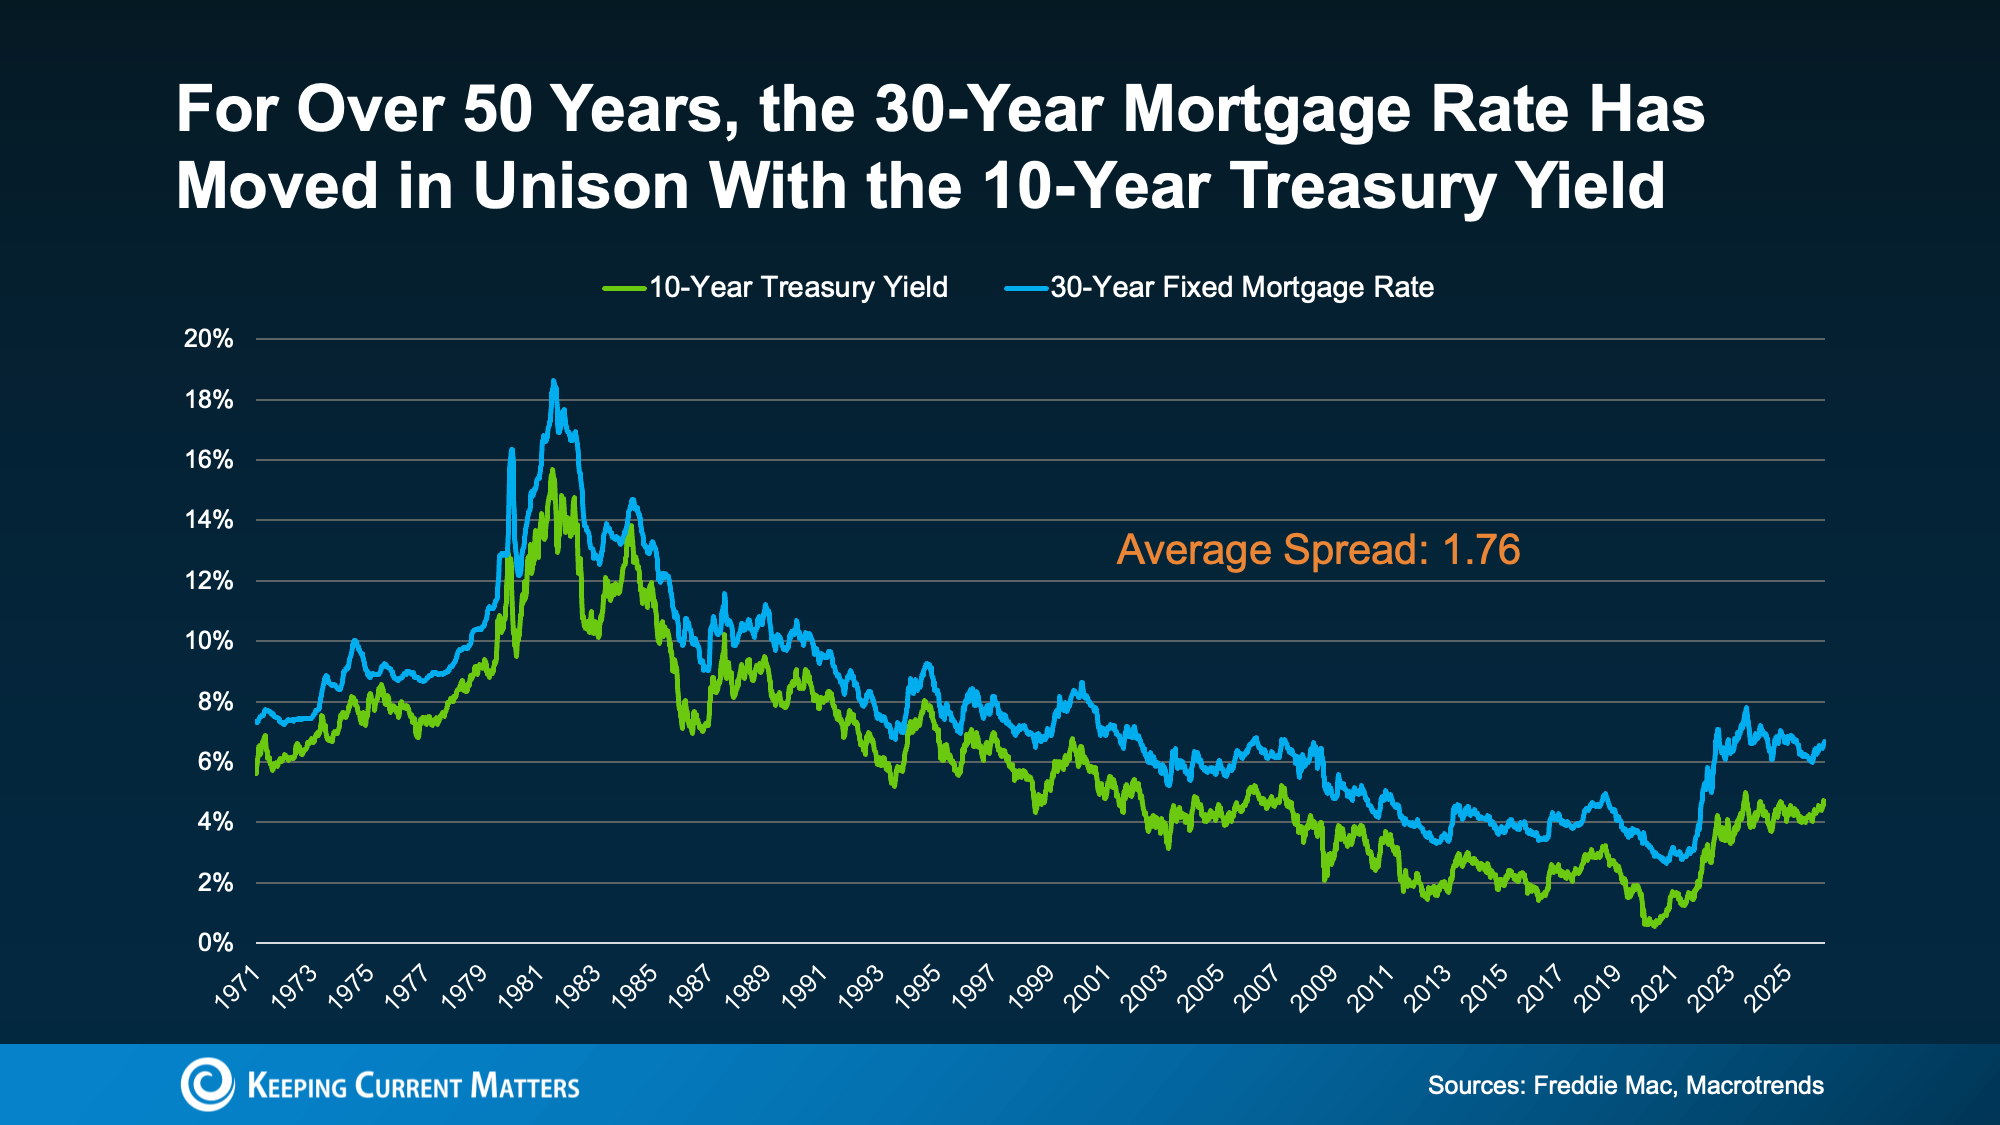
For more than 50 years, mortgage rates and the 10-year Treasury yield have moved in a closely related pattern.
The gap between them has a name. It is called the spread. Over the long run, that gap has averaged about 1.76 percentage points. When the spread widens, mortgage rates can run higher than the Treasury yield alone would suggest. When it narrows, mortgage rates move closer to that yield.
Here is what the data is showing right now.
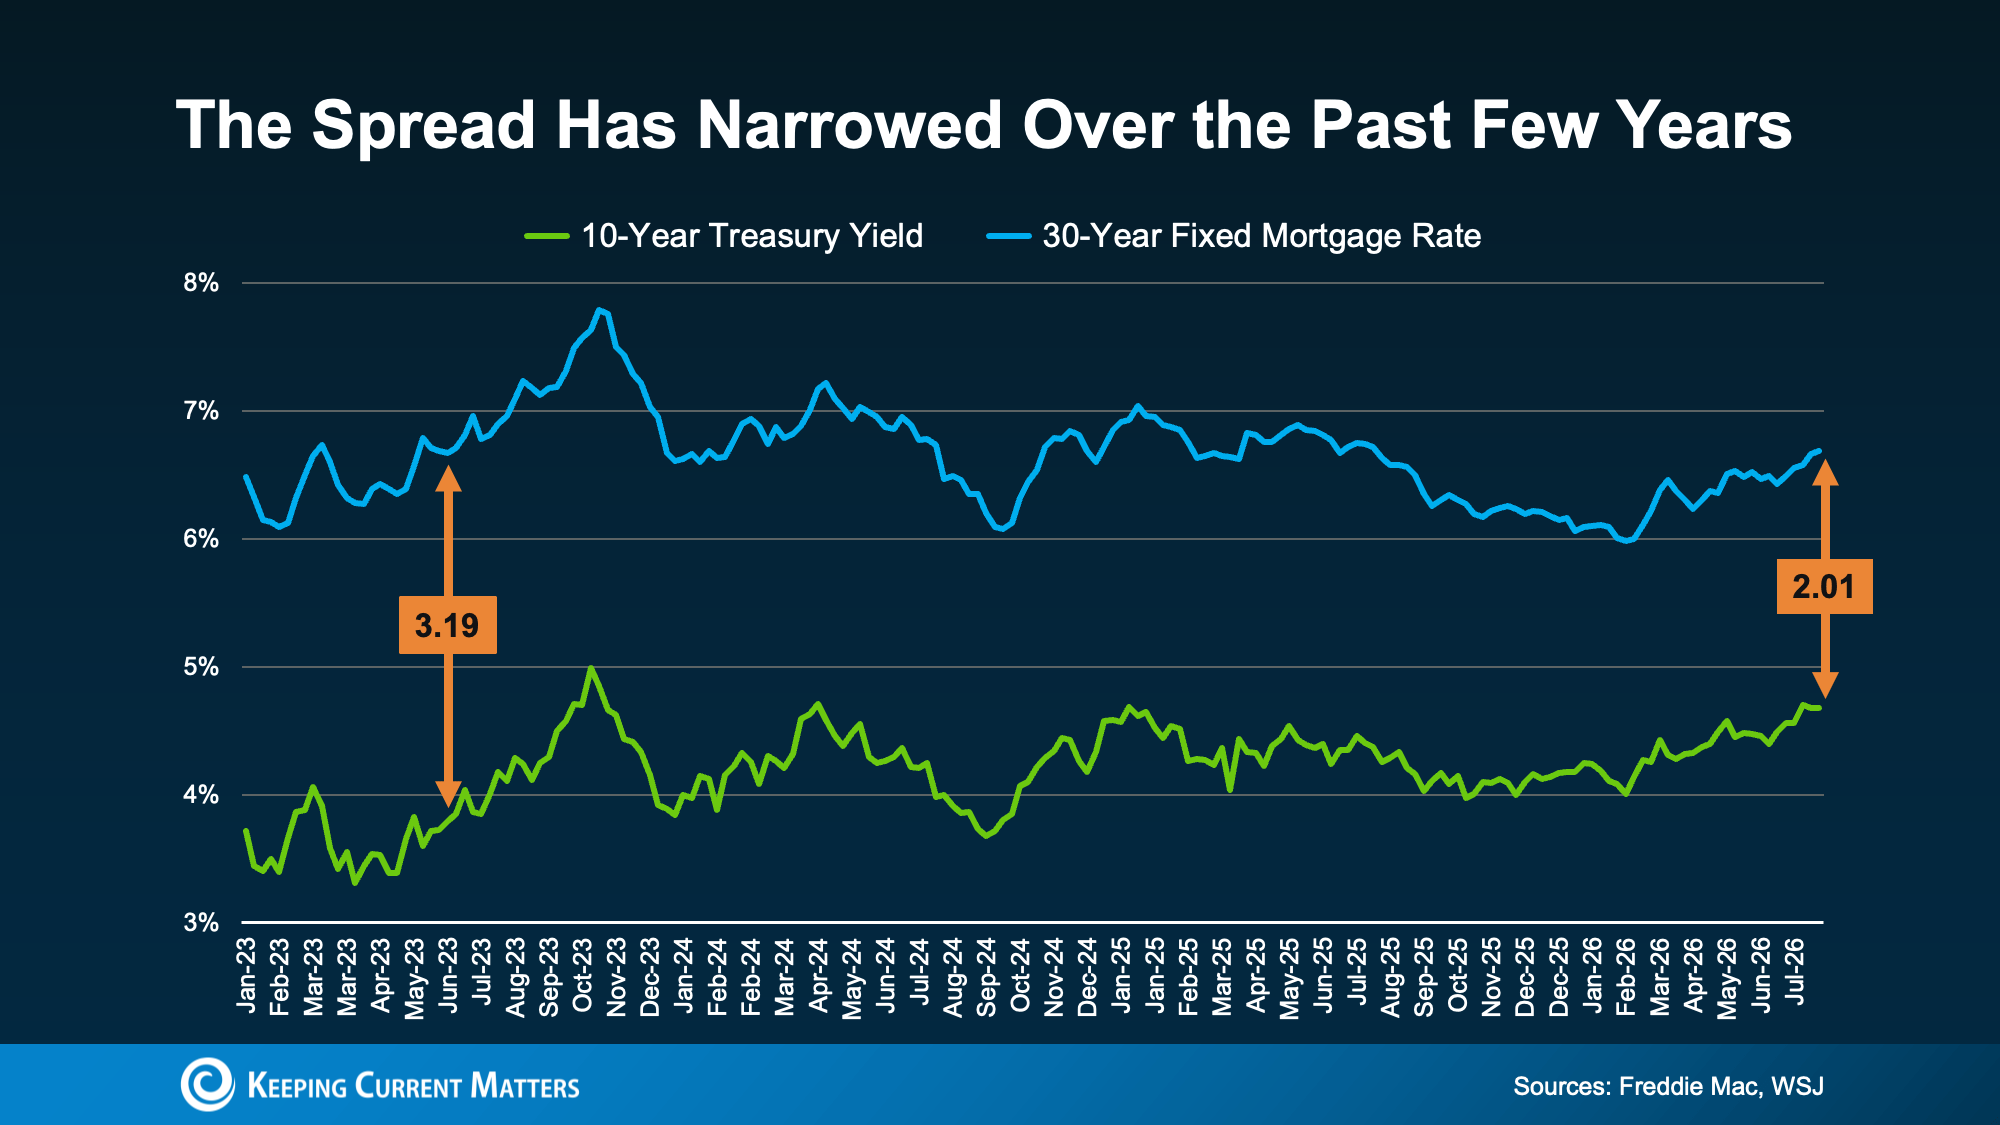
A few years ago, that gap blew wide open. Economic uncertainty pushed it as high as 3.19 points in 2023.
It has been narrowing since. The spread used in the latest market example is around 2.01—just above the long-term average of 1.76.
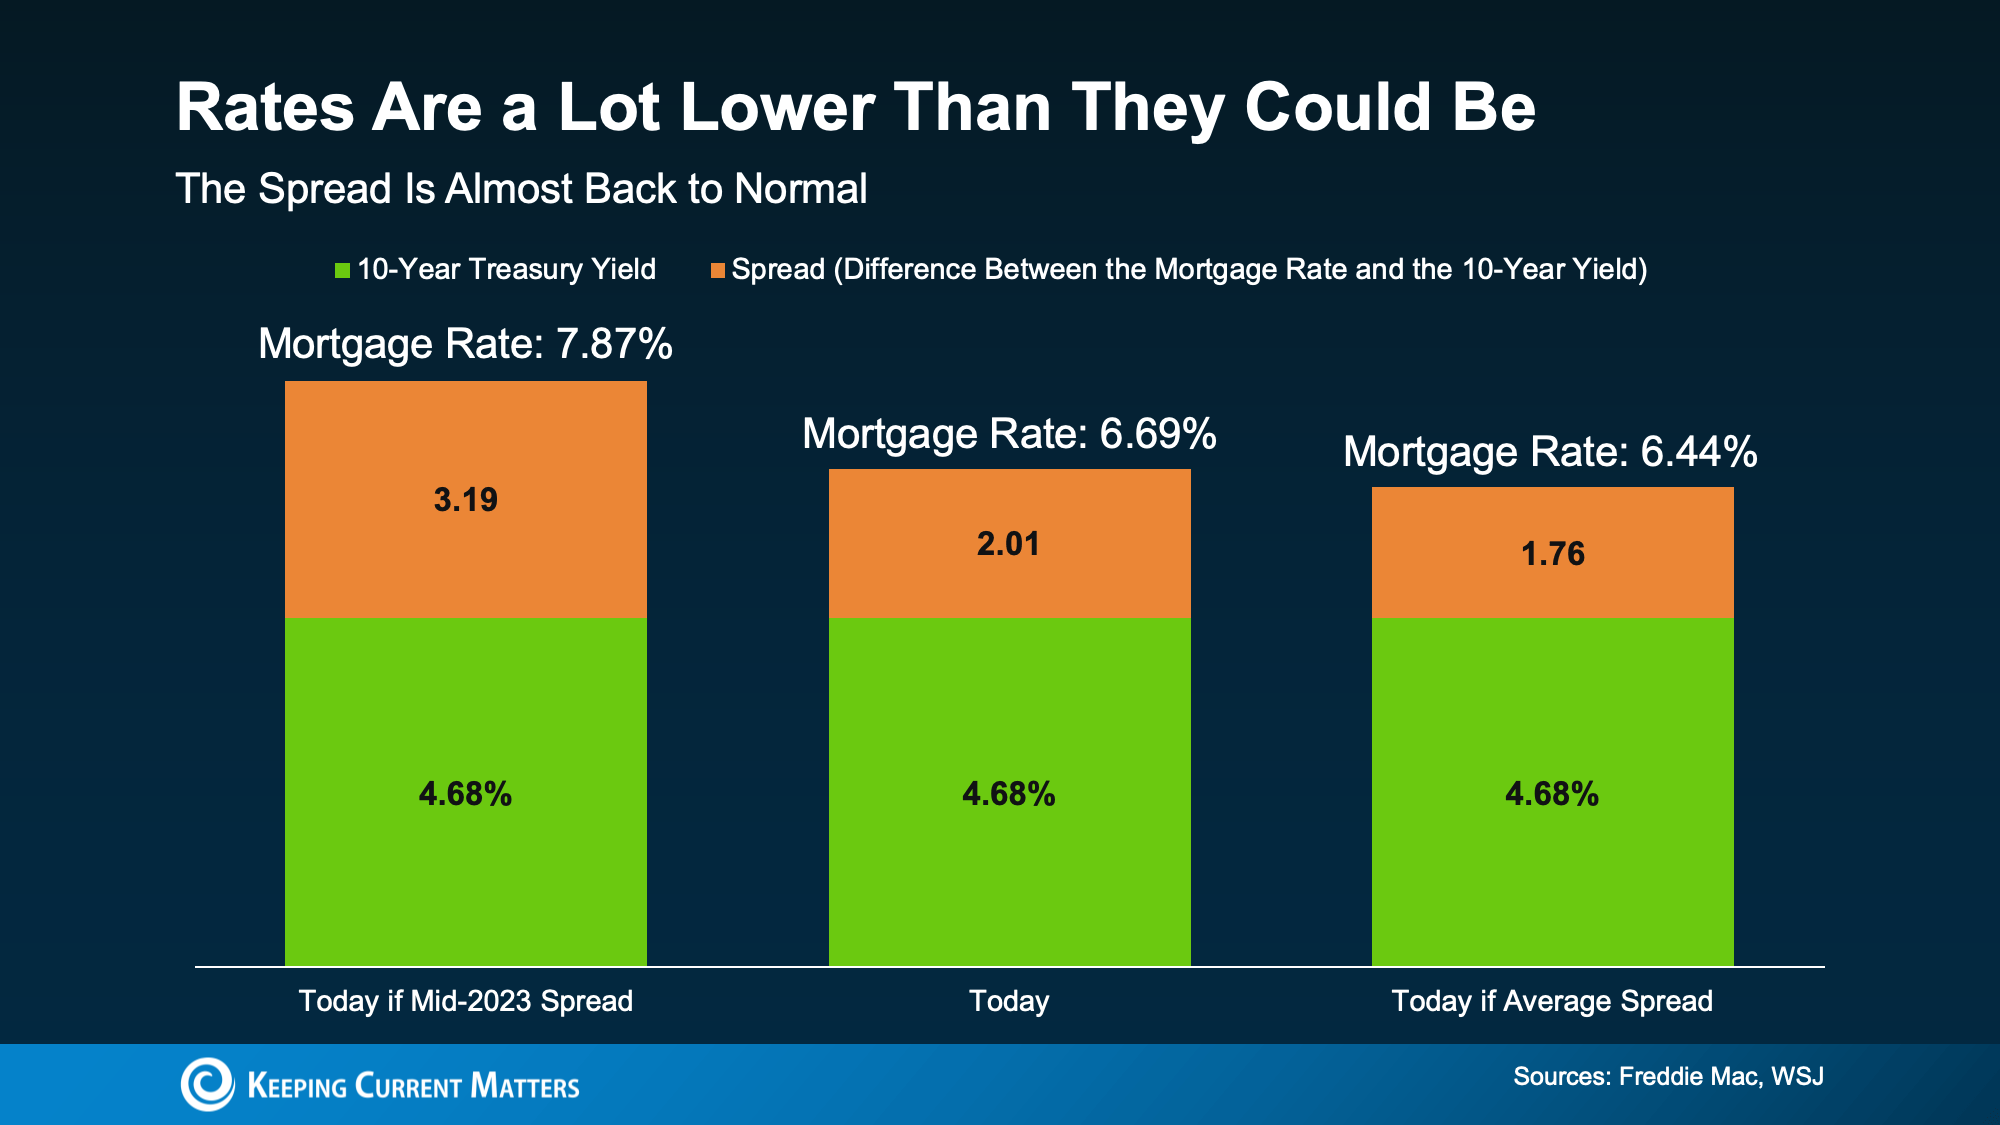
Here is why that matters to your monthly payment. Using a 10-year Treasury yield of 4.68%, run that number through three different spreads and watch what happens.
Add a spread that wide to a 4.68% Treasury yield and mortgage rates would be pushing close to 8%.
With the spread narrowed to about 2.01, the mortgage-rate example sits around 6.69%.
If the spread returned all the way to its long-term average, the example lands around 6.5%.
“Mortgage spreads being better in 2026 is the housing hero story of the year.”
Logan Mohtashami · Lead Analyst, HousingWire
What the headlines always leave out.
Here is the part nobody puts in the headline. That narrowing spread is the same reason rates are not close to 8% right now—and the same reason they may not have a lot of room to fall from the spread alone.
You are already most of the way back toward that long-term average. There is simply less room left for that particular gap to close.
Rates are not where anyone wishes they were. But they are meaningfully better than they could have been, and a large move lower would likely require more than continued spread normalization. It would also require movement in the underlying Treasury yield and broader bond market.
That is why I would not build an entire homebuying plan around the hope that one national rate finally hits the number you have in your head. There are other moving pieces too, including home-price trends, competition, insurance, and the complete monthly payment.
What this means for your plan.
Here is the shift I want you to make. Stop asking only what the market’s rate will do. Start asking what your rate will do.
The 6.69% you see in this market example is not automatically the rate a lender quotes you. Your actual mortgage pricing is built on your complete loan profile, including your credit score, debt-to-income ratio, down payment, loan type, occupancy, property type, points, and other factors.
You cannot control the Treasury yield.
You also cannot personally control the mortgage-market spread. Those numbers move with the bond market, investor demand, risk, and the broader economy.
You can improve the numbers attached to you.
Credit, debt, available cash, down payment, reserves, and loan structure are where preparation can change the financing conversation.
Start with your debt-to-income ratio.
Under Rule 8 in our system, your DTI should sit at 35% or below. The point is not that every mortgage program uses one identical cutoff—it does not. The point is to give your household more room before the new housing payment is added.
Run your numbers using the Debt-to-Income Calculator before you shop. Your DTI affects qualification, buying power, and which loan structures may be available to you.
Protect your credit before the lender pulls it.
Under Rule 7, your credit profile can materially affect the pricing a lender offers. Under Rule 3, keep revolving utilization under 10% of your available limit when possible and pay balances responsibly. The goal is to have your credit doing work for you before you ever sit down with a lender.
Know what your down payment is doing.
Under Rule 6, the size of your down payment matters too. Ten percent down can be a strong position. Twenty percent down on a conventional loan may eliminate private mortgage insurance, depending on the transaction, and can lower the complete monthly housing cost even if the posted market rate does not move an inch.
And remember: the mortgage rate is not the whole payment. Taxes, homeowners insurance, mortgage insurance when applicable, and HOA dues can change what the home really costs each month. That is why I recommend pricing the complete housing payment—not only the interest rate.
Call the difference between the national headline and the rate you actually earn through your financial profile your personal spread. You cannot touch the Treasury yield. You cannot touch the market spread. You can absolutely work on the numbers attached to you.
Let’s find out what rate and payment your profile supports today.
We can review your credit profile, income, debts, DTI, down payment, reserves, loan options, and complete estimated payment so you know whether waiting actually improves your plan.
Talk With PatThe question you should be asking together right now.
Not: “When will rates drop?”
The real question is: What rate would we actually qualify for today, based on our credit, our DTI, our down payment, and the loan that fits us—and what is improving those numbers worth to us this month?
My wife and I have watched rates move through more cycles than I can count in 34 years of marriage and real estate. The couples who come out ahead were never simply the ones who guessed the market right. They were the ones who got their own numbers in order while everyone else was waiting on someone else’s number to move.
Know exactly how much of your gross monthly income is already committed to recurring debts and the proposed housing payment.
Review your scores, balances, utilization, payment history, and any errors before you are under contract.
Decide how much cash should go into the purchase and how much needs to remain available after closing.
That is the conversation to have with your spouse this week—not the one about where the Fed goes next.
Bottom line
Mortgage rates are influenced by the 10-year Treasury yield and the spread between Treasury yields and mortgage pricing. That spread has already improved substantially from its 2023 peak.
So do not make your entire plan dependent on a dramatic rate drop that may or may not arrive on your timetable. Understand the market number, then work the numbers you can actually influence.
Run your DTI. Check your credit. Know your down payment. Then find out what your real rate looks like today.
Educational disclosure: This article is for general educational purposes and is not individualized mortgage, financial, legal, tax, insurance, credit, investment, or real estate advice. Mortgage rates and Treasury yields change frequently. Mortgage pricing varies by lender, loan program, credit profile, occupancy, property type, loan amount, down payment, points, market conditions, and other factors. Debt-to-income guidelines and mortgage-insurance requirements also vary by program and borrower profile. Consult qualified mortgage, financial, tax, legal, insurance, and real estate professionals regarding your situation.
Reference sources: Keeping Current Matters, U.S. Department of the Treasury, and HousingWire.