

You saw the headline. Home prices are falling. Then, the same week, you saw another one saying prices are still climbing.
So you keep asking one question. Are home prices falling or not? And until somebody gives you a straight answer, you wait.
Here is my answer. The headline is not measuring your market. A national average is a blend of hundreds of local markets moving in different directions. You do not buy or sell a national average. You buy or sell one house, on one street, in one market.
I want to show you why the headlines keep contradicting each other, what the data actually says right now, and the numbers I run before anyone waits, buys, or lists based on a headline.
The national median asking price dipped about 3% from early August to October, and a lot of that is the normal fall slowdown. Over the past year, prices rose almost 7% in Chicago and dipped about 1.6% in Seattle. Your plan should run on your local market and your own guardrails, not on a national headline.
First, Are Home Prices Falling? Why the Headlines Keep Contradicting Each Other.
Because they are measuring different things.
One headline measures asking prices. Another measures closed sales. One looks at the last two months. Another looks at the last twelve.
And almost all of them measure the whole country at once.
Here is what is moving the numbers right now. According to HousingWire Data cited by Keeping Current Matters on October 21, 2026, there are more homes for sale than at any time since November 2019.
More homes on the market means more choices for buyers. Homes take longer to sell. Some sellers cut their asking price to move faster.
That is real. It is also not the same thing as a market-wide price collapse. I broke down what more inventory means for your plan in why waiting for more homes to choose from has a catch.
Here Is What the Data Is Showing Right Now.
Start with the number behind the "prices are falling" headline.
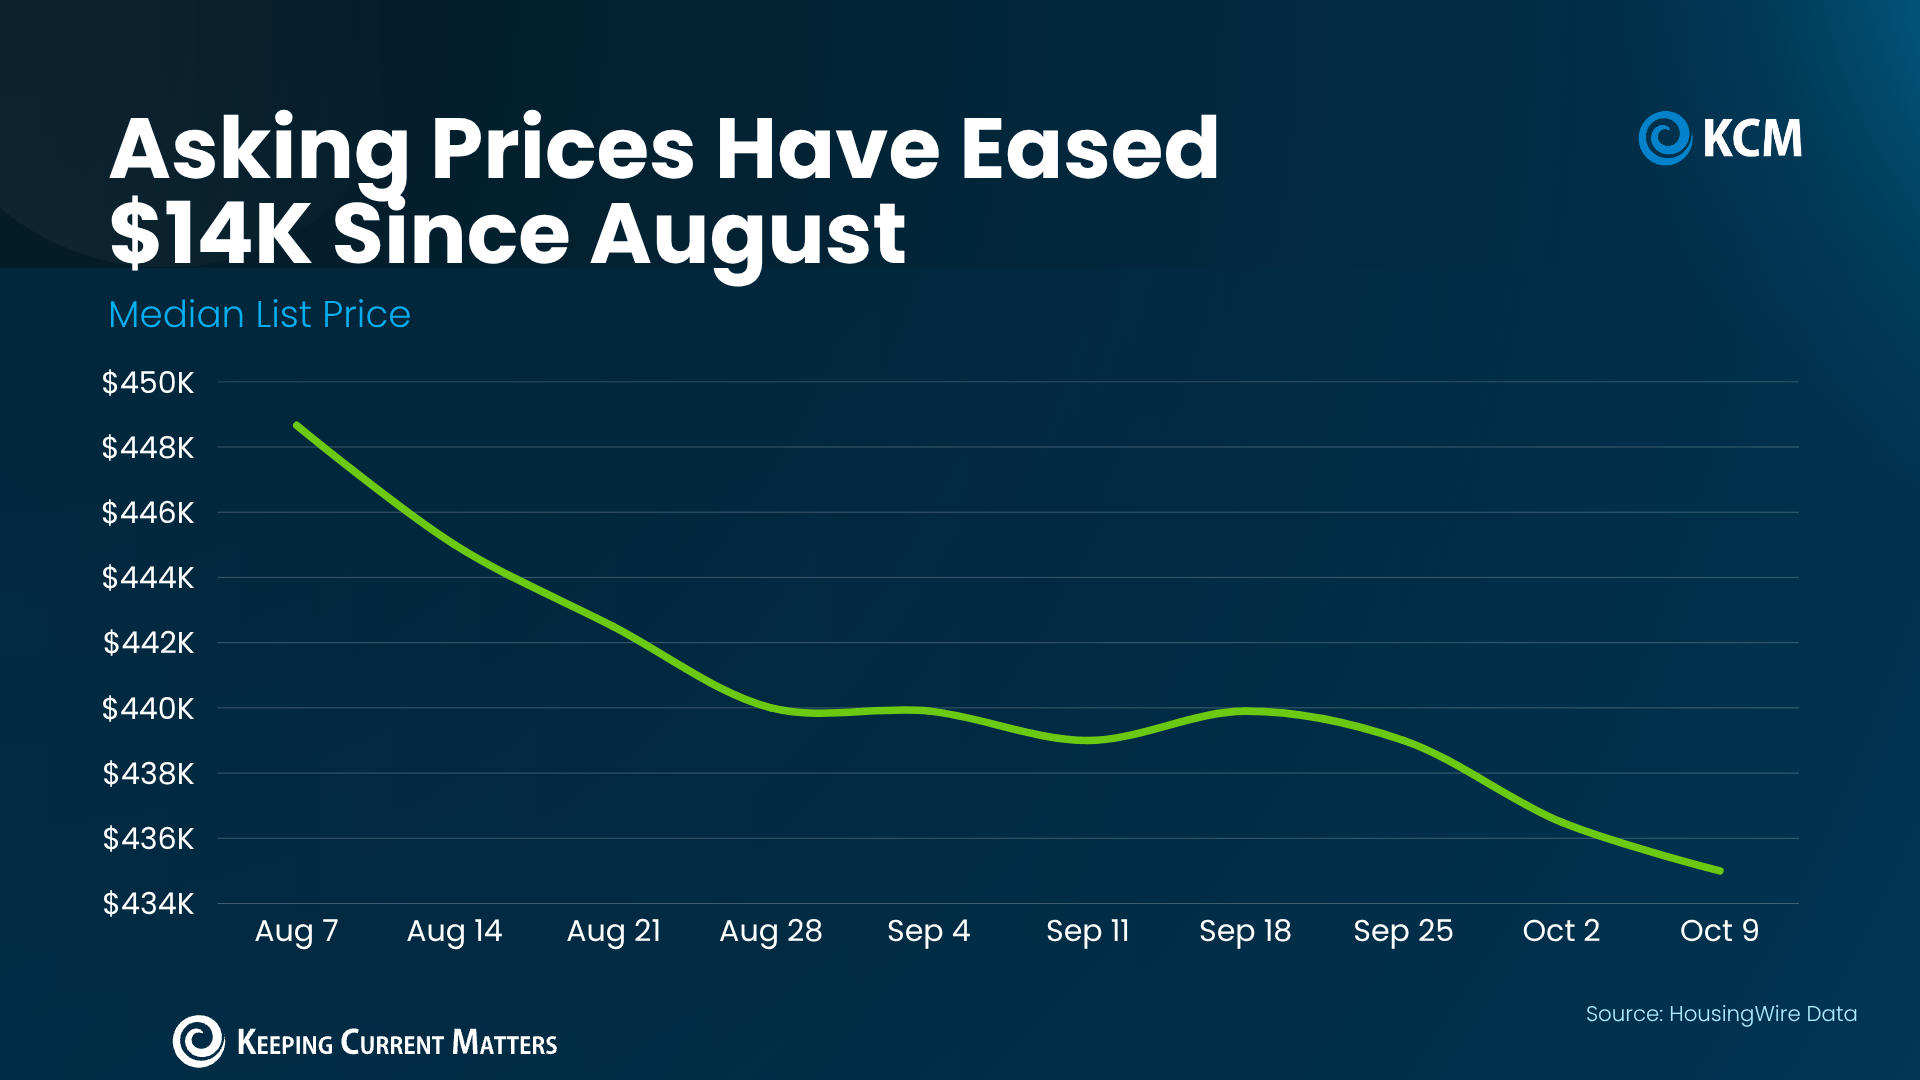
According to HousingWire Data cited by Keeping Current Matters, the national median asking price fell from $449K in early August to $435K about two months later. That is a drop of about 3%.
Now look at the calendar.
Asking prices cool off every fall once the busy summer season wraps up. Keeping Current Matters put it plainly: a lot of this dip is normal for this time of year.
Then look local. This is where the story splits.
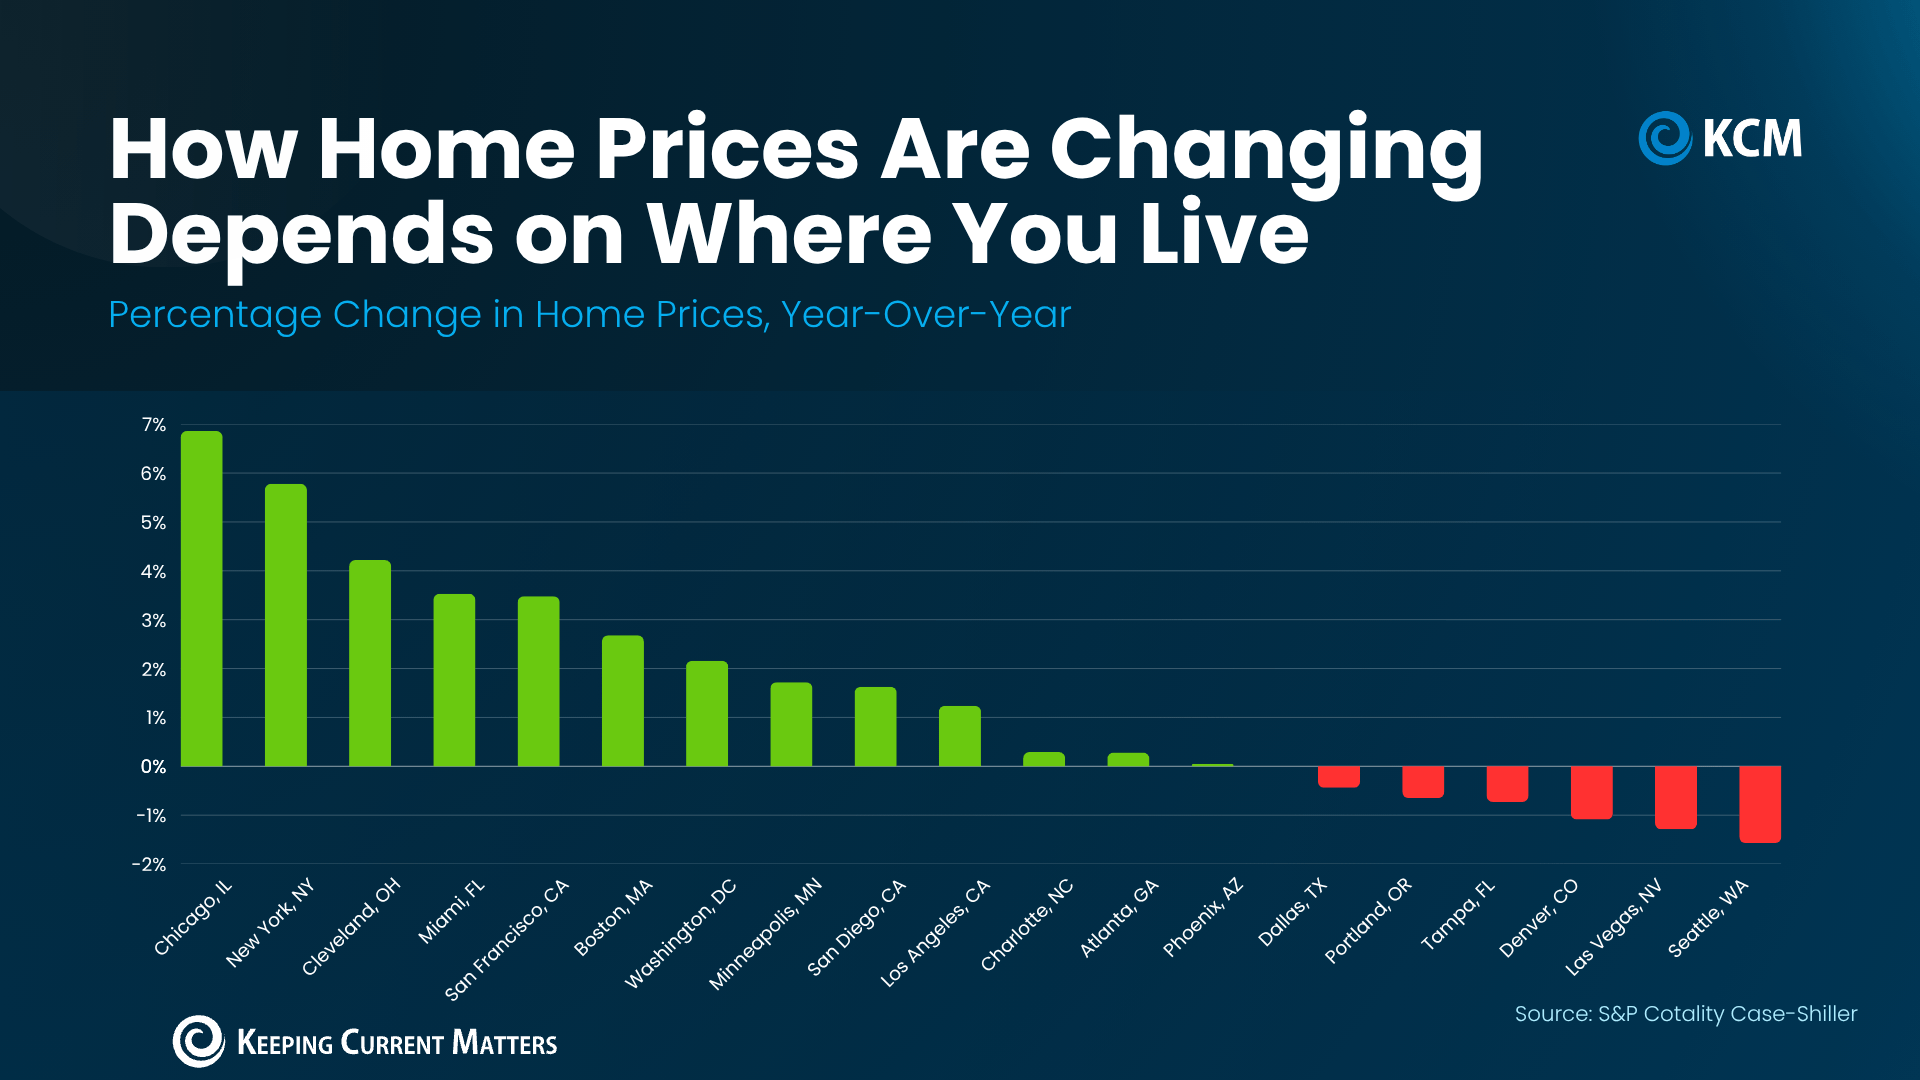
According to the S&P Cotality Case-Shiller Index released September 29, 2026, as cited by Keeping Current Matters, prices over the past year rose almost 7% in Chicago and almost 6% in New York. In Seattle, they dipped about 1.6%.
That is a gap of nearly 9 percentage points.
Same country. Same year. Opposite stories.
And in the major metros where prices are falling, Keeping Current Matters reports the declines are 2% or less. That is a softer market in a few places. It is not 2008.
If you want the bigger picture on where prices have been heading, read what it means that home prices are starting to move again.
What the Headlines Always Leave Out.
Three things. Every time.
The season. A fall dip in asking prices is the calendar, not a trend. If you want a fair read, compare this October to last October. Not to this August.
Asking is not selling. An asking price is what a seller hopes for. A closed sale is what a buyer actually paid. Headlines mix the two all the time.
The long run. The Federal Housing Finance Agency reports that national prices have posted annual gains every quarter since the start of 2012. In its Q2 2026 House Price Index release on August 25, 2026, FHFA reported U.S. prices up 2.1% from Q2 2025 to Q2 2026, with prices rising in 46 states and D.C.
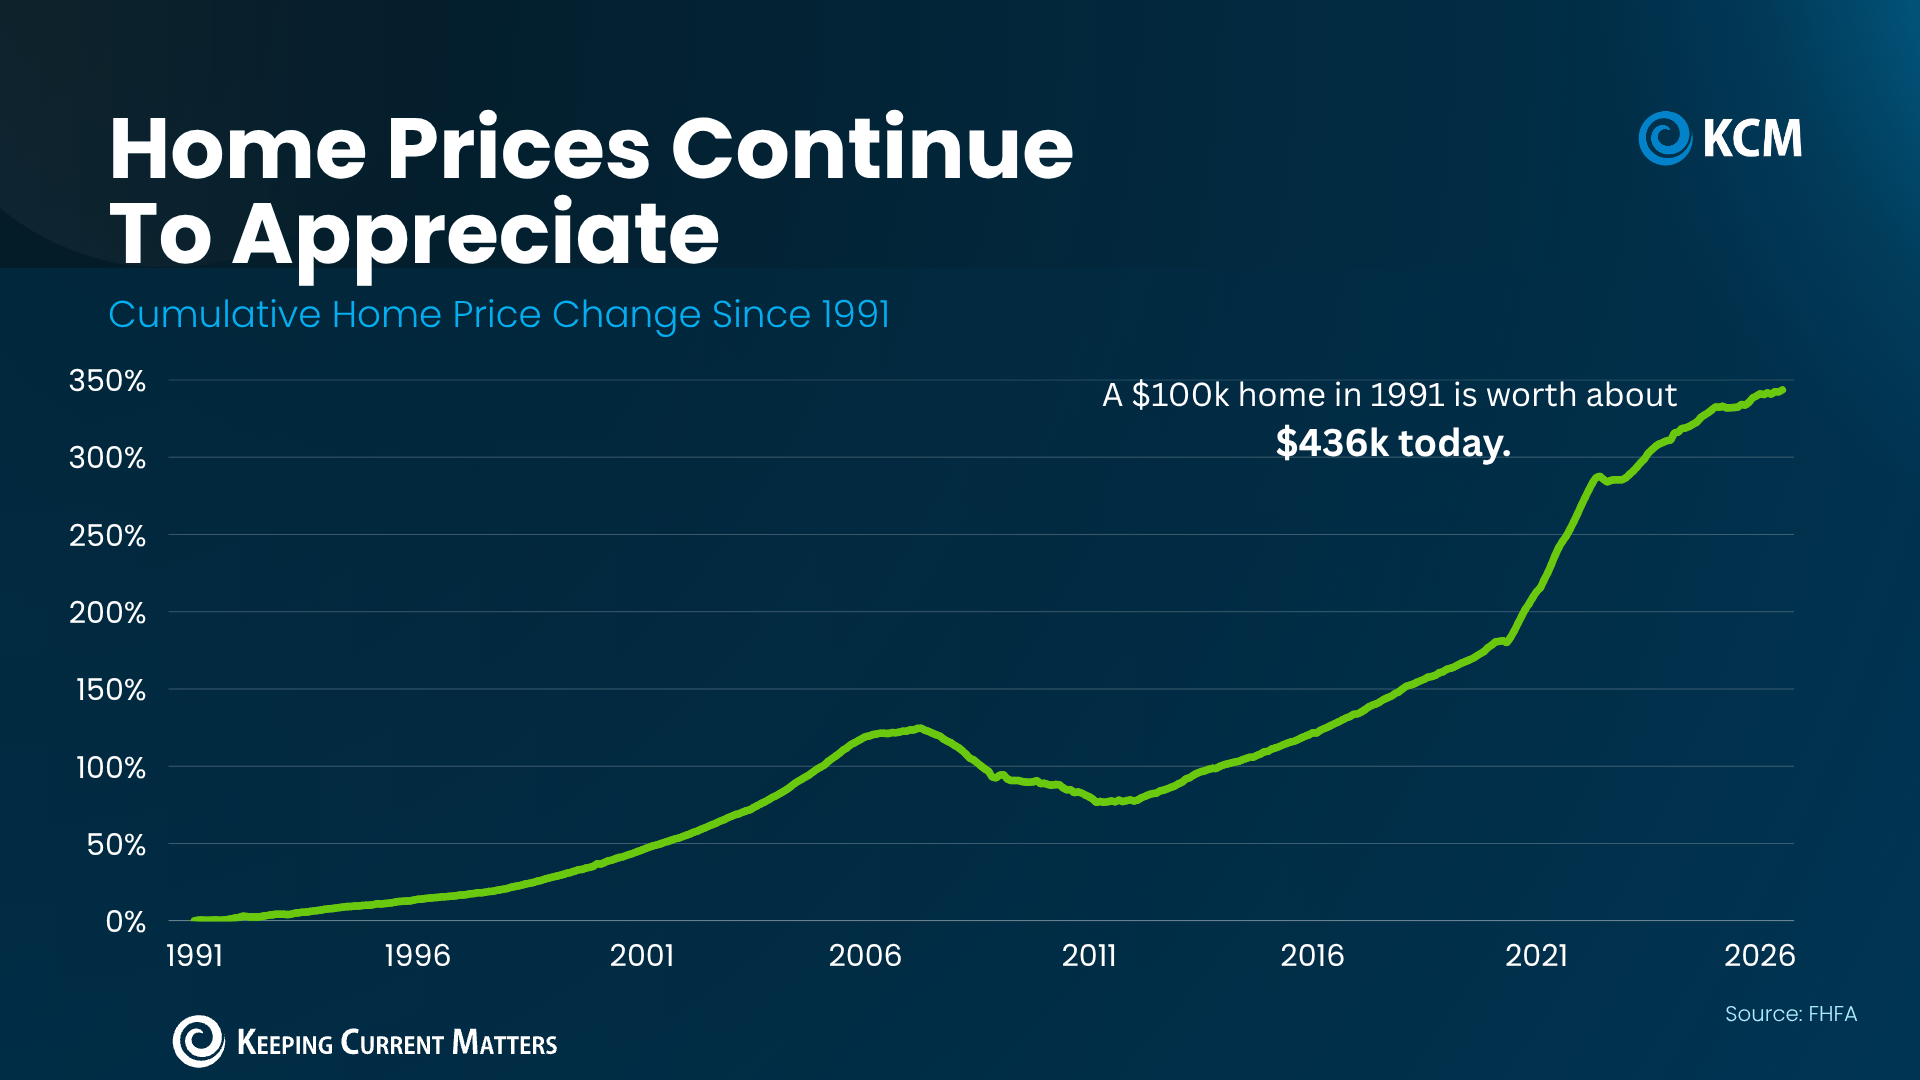
Using FHFA data, Keeping Current Matters notes that a $100K home bought in 1991 would be worth about $436K today. That includes the 2008 crash.
Realtor.com said it in one line, as cited by Keeping Current Matters: "Local trends can diverge sharply from national averages."
That is the whole point. The national number is not your number.
What This Means For Your Plan.
Stop reading the national number. Pull your market's number. Then run your own.
If you are buying:
A headline about falling prices is not a reason to wait. It is a reason to negotiate.
In markets where homes are sitting longer, you have room to ask. Price. Repairs. Closing cost credits. That leverage exists right now, in the markets that have it.
Now look at what waiting does when you get the market wrong.
Say a couple is shopping for a $600,000 home. If their local market moves the way Chicago did over the past year, up almost 7%, waiting 12 months for a drop that never comes adds about $42,000 to the price.
If their market moves the way Seattle did, down about 1.6%, waiting saves them about $9,600.
Same couple. Same house. A $51,600 swing based on the zip code.
That is a hypothetical, not a forecast. The point is simple. You cannot make that call from a national headline.
And before you look at price at all, check the budget. Here are the guardrails I teach: housing at about 30% of gross income or less, total debt-to-income at 35% or less, at least 10% down and ideally 20% to avoid PMI, and a full emergency fund in place.
Back to our couple. Say they earn $13,000 a month gross. Their housing payment should land at $3,900 or less. Their total monthly debt, house included, at $4,550 or less. On a $600,000 home, 10% down is $60,000. 20% down is $120,000.
If the payment fits those guardrails, a 1.6% dip is not the deciding factor. If it does not fit, a 3% dip will not save the plan.
The negotiating side matters too. I covered it in who has the upper hand in buyers vs sellers markets.
If you are selling:
The fall dip hits asking prices first. Price your house to the closed sales in your neighborhood, not to last spring's list prices.
Ask your agent which homes near you sold, which sat, and what the difference was. If homes around you are sitting, a sharp price now beats chasing the market down later.
Know where your house sits in the market before that conversation. My breakdown on which side of the housing market split your house is on walks through it. And if you are tempted to pull the listing and rent it out instead, read the problem with renting as the backup plan first.
Here is where I land. Headlines do not set your price. Your local market and your guardrails do.
See what your payment looks like in your market before a headline decides for you.
We can run the payment on the home you want, check it against your DTI and housing targets, and show you what a price change really does to your monthly number.
Talk With PatThe Question You Should Be Asking Together Right Now.
Not, are home prices falling?
The better question is: what are prices doing in the neighborhood we want, and does the payment fit our guardrails either way?
Answer that together, with real numbers, before you wait another season.
Ask a local agent for closed sales in your target area over the last 6 months. Compare this month to the same month last year.
Housing at about 30% of gross monthly income or less. Total DTI at 35% or less. At least 10% down, ideally 20%. Full emergency fund in place.
Decide the price and payment you will walk away at. Then let the market come to you, not the headline.
Put it on the agenda for your next Money Meeting. Lay out the local numbers and decide as a team.
A headline is not a plan.
Bottom Line
National asking prices dipped about 3% this fall, and a lot of that is the season. Locally, prices over the past year ranged from up almost 7% to down about 1.6%. Long term, FHFA data show national prices have risen year over year every quarter since 2012.
So are home prices falling? In some places, a little. In others, they are still rising. The only answer that matters is the one for your market.
Do not let a national headline make a local decision for you.
Your next step: ask a local agent for the closed sales where you want to buy or sell, then talk it through with me so we can run the payment against your guardrails.
Pat Collins, Mortgage Advisor | NMLS #1628553
Educational disclosure: This article is for general educational purposes and is not individualized mortgage, financial, legal, tax, insurance, credit, investment, or real estate advice. It is not a loan offer or a commitment to lend. Loan qualification, down payment and mortgage insurance requirements, and program guidelines vary by borrower, property, occupancy, loan program, lender, market, and timing. Home price data reflect the sources and periods cited and do not predict future prices in any market. Examples are hypothetical and rounded. Review current written terms with the appropriate licensed professionals before making a decision.
Reference sources: Keeping Current Matters — “Confused by Home Price Headlines? Here’s Why.”, October 21, 2026. Inventory and asking price data from HousingWire Data; metro price data from the S&P Cotality Case-Shiller Index, September 29, 2026; long-term price data from the FHFA House Price Index, August 25, 2026, and the FHFA HPI 2026 Q2 report. Realtor.com quote as cited by Keeping Current Matters.